App preview
Inside Trade Master 9.
Fundamental analysis is another tool for forecasting price dynamics, and original fundamental data is available straight from Trade Master 9.
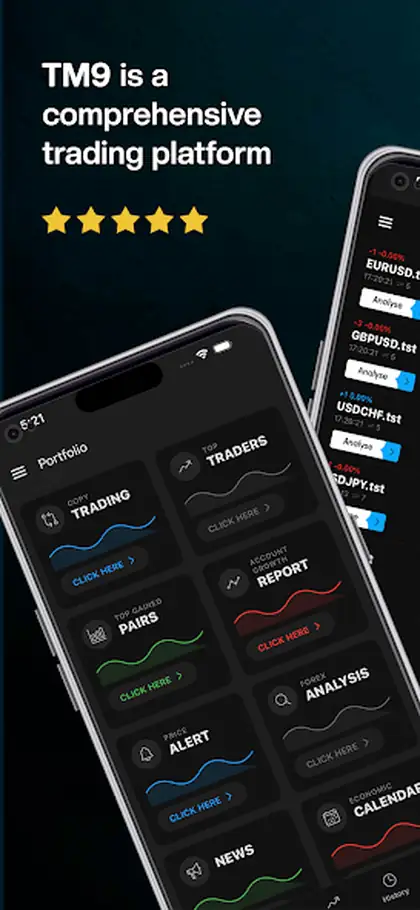
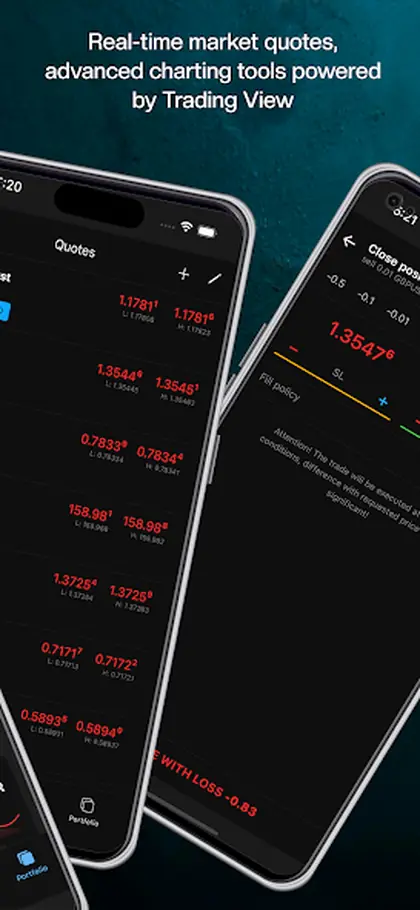
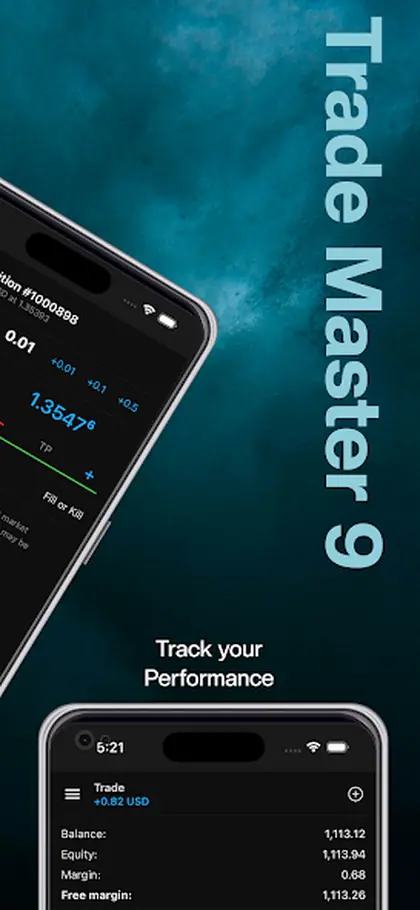
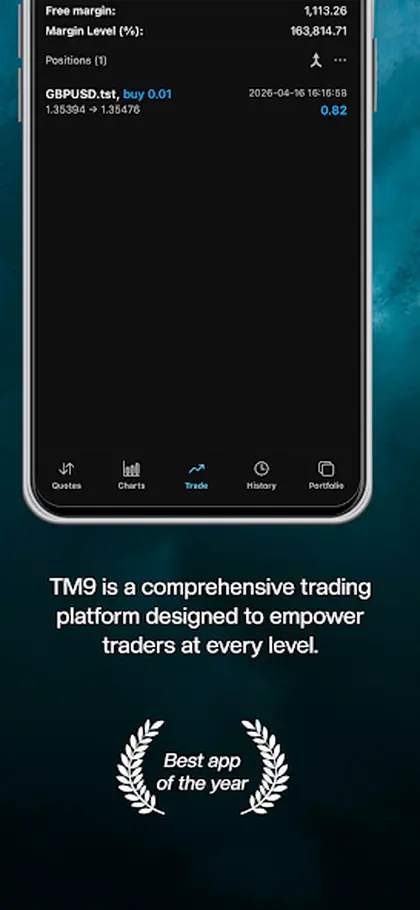
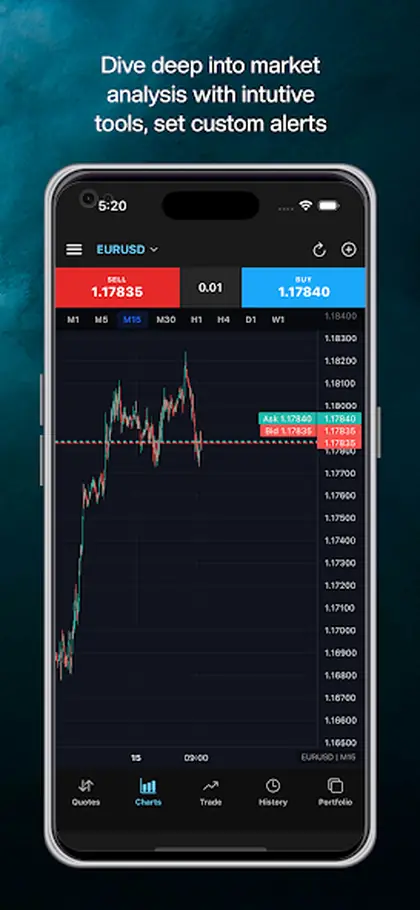
Prices in the forex and exchange markets move on news, so this trading mobile app carries the news with the charts.
Fundamental analysis is another tool for forecasting price dynamics, and original fundamental data is available straight from Trade Master 9.
Charts show what has happened; fundamentals explain much of why, and a trading mobile app for operations in the Forex and exchange markets is more useful when both live in the same window. Trade Master 9 broadcasts news reports from international agencies straight into the platform and includes an economic calendar covering the main macroeconomic indicators of different countries.
Fundamental analysis, in practice, is the constant monitoring of open-source economic and industrial data used to forecast price dynamics. For a currency trader that means interest rate decisions, inflation prints and employment figures. For someone trading indices it extends to growth data and earnings seasons. For commodities it reaches into inventories and supply disruptions. The common thread is that these arrive on a schedule, and the schedule is knowable in advance.
Having the feed inside the terminal changes the habit rather than the analysis. Instead of checking a separate site and hoping you did not miss anything, you see what is due before the session starts and can tie a sudden move to a release as it lands. That is often enough to decide whether a setup is worth taking at all, or whether the sensible trade is to wait twenty minutes.
Traders who ignore fundamentals entirely can still do well, but they tend to lose money on the same days each month, which is a clue worth acting on. None of this predicts the reaction. Markets respond to the gap between expectation and outcome, not to the number itself, which is why experienced traders use fundamentals mainly to decide when not to have a position on. Combined with the charting tools described elsewhere in this section, it covers both halves of the picture. The home page has the full detail on the app.
Fundamental analysis is another tool for forecasting price dynamics, and original fundamental data is available straight from Trade Master 9.
News from international agencies and an economic calendar, delivered straight into the platform.
The aim is the constant monitoring of various open-source economic and industrial indicators, used to forecast the price dynamics of financial instruments.
News reports from international news agencies are broadcast directly into the platform, providing you with the essential financial information.
The economic calendar features the main macroeconomic indicators of different countries, allowing traders to analyze their impact on various financial instruments.
Three short notes on how this works day to day.
Having news and the calendar in the same window as the chart changes the habit: instead of checking a separate site, you see what is due today before placing a trade, and you can tie a move to a release as it happens.
Fundamental data explains context, not timing. It is most useful for knowing when not to have a position on, which is why experienced traders read the calendar before the session rather than during it.
This page suits traders who hold positions through releases, and anyone who has been caught by a scheduled number they did not know was coming.
How analysis sits inside the Trade Master 9 platform.
Trade Master 9 represents the all-in-one concept: up to 100 charts at a time, 21 timeframes, more than 80 technical indicators and graphic objects, plus thousands of free indicators in the Code Base and over 2500 applications in the Market. Fundamental analysis is covered too, with news from international agencies and an economic calendar built into the terminal.
TM9 is a software development company and does not provide investment or brokerage services. The platform supplies the trading terminals, analysis tools and automation; your broker holds the funds, sets spreads and leverage, and executes the orders the platform sends. Trading carries a real risk of loss, and signals or robots are tools rather than financial advice.
Technical Analysis. Timeframes and Charts. Technical Indicators. Or open the Platform Guide for all 20 pages.