App preview
Inside Trade Master 9.
The economic calendar features the main macroeconomic indicators of different countries, allowing traders to analyze their impact on various financial instruments.
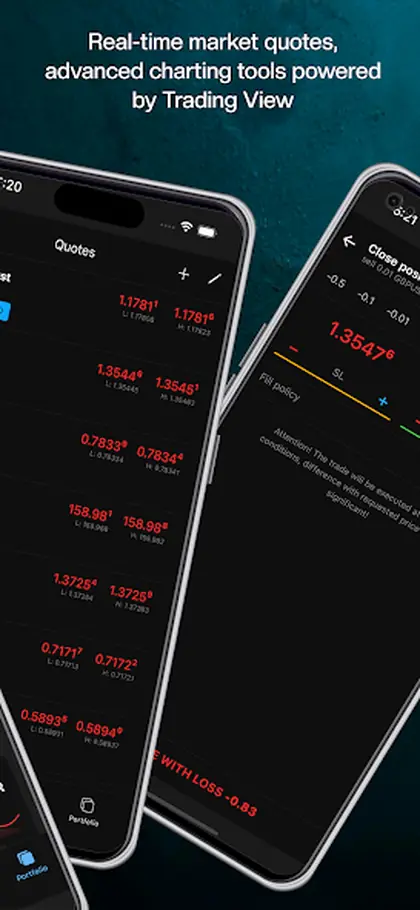
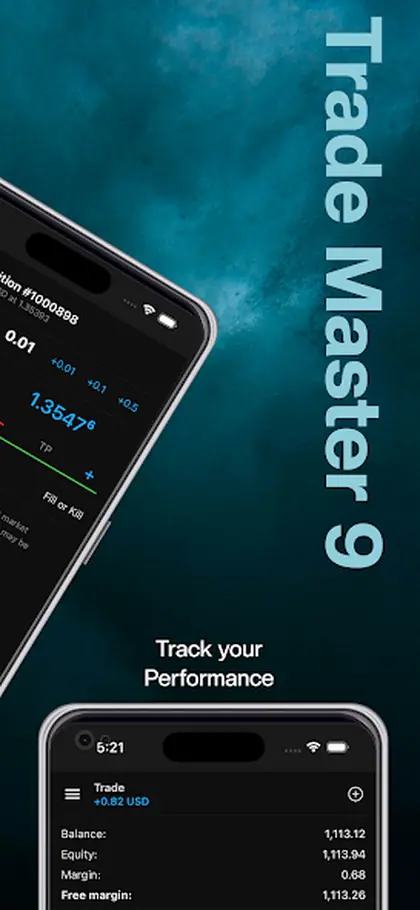
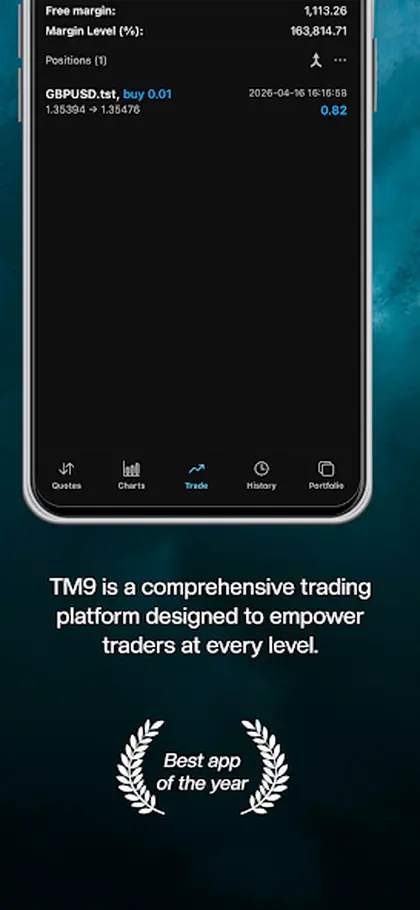
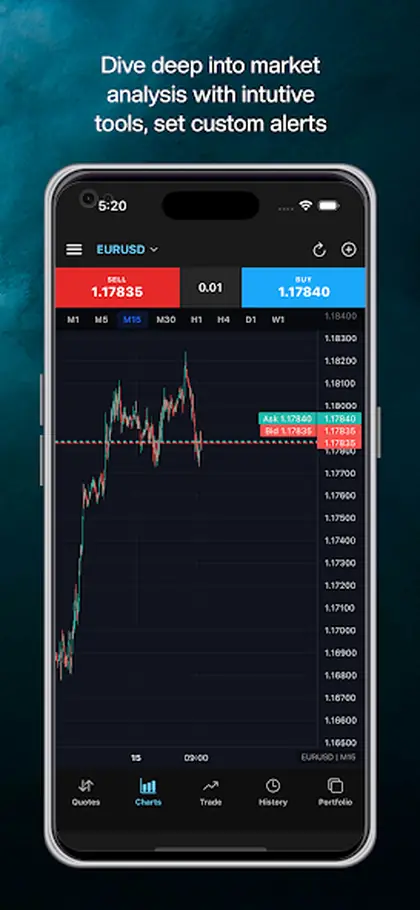
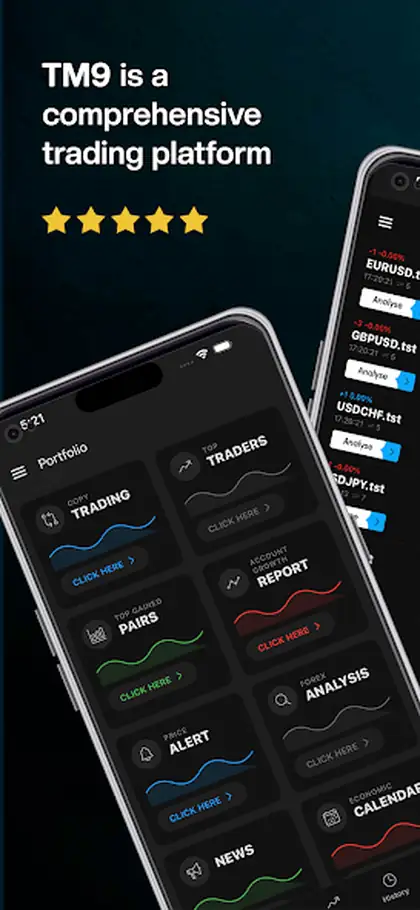
Scheduled data moves the forex and exchange markets on a timetable, and this trading mobile app puts that timetable beside your charts.
The economic calendar features the main macroeconomic indicators of different countries, allowing traders to analyze their impact on various financial instruments.
Some market moves arrive without warning. Many arrive precisely on time, which is why the economic calendar inside a trading mobile app for operations in the Forex and exchange markets is one of the more practical tools it contains. Trade Master 9 includes a calendar of the main macroeconomic indicators of different countries, alongside news broadcast from international agencies.
The value is in preparation rather than prediction. Ten minutes before the session, the calendar tells you which releases affect the instruments on your watchlist and when they land. From there the decisions are simple: trade before and stand aside, hold through with a wider stop, or wait for the reaction and trade what follows. All three are reasonable. Being surprised by a scheduled release is not.
The calendar also gives context to moves that would otherwise look random. A currency pair that breaks a level at half past one on no apparent trigger is usually responding to something listed, and seeing that at a glance prevents the worse mistake of assuming a structural break where there was only a data print.
It also helps with position sizing: a trader who knows a major release lands at half past one can take half the usual size that morning, or be flat before it. Over time, the calendar shapes routine more than strategy. Traders learn which releases genuinely move their instruments and which ones pass without a ripple, and the list of events they care about gets shorter. That is a good outcome: fewer things to watch, each of them meaningful. The neighbouring pages cover the news feed and the charting side of analysis, and the TM9 home page brings the whole app together.
The economic calendar features the main macroeconomic indicators of different countries, allowing traders to analyze their impact on various financial instruments.
The built-in economic calendar covers the main macroeconomic indicators of different countries.
The main macroeconomic indicators of different countries, arranged by release time so you can see what is due and when.
The calendar exists to let traders analyze the impact of each indicator on various financial instruments, rather than simply listing dates.
It sits next to news reports broadcast into the platform from international news agencies, so scheduled and unscheduled information arrive in the same place.
Three short notes on how this works day to day.
A simple routine covers most of the value: check the calendar before the session, note the releases affecting your instruments, and decide in advance whether you will hold through them or stand aside.
Consensus figures and past values give context, but the reaction to a release is often about the gap between expectation and outcome rather than the number itself. The calendar tells you when to pay attention, not what will happen.
This page is for traders holding positions across sessions, and for anyone trading currencies where central bank and inflation releases set the tone.
How analysis sits inside the Trade Master 9 platform.
Trade Master 9 represents the all-in-one concept: up to 100 charts at a time, 21 timeframes, more than 80 technical indicators and graphic objects, plus thousands of free indicators in the Code Base and over 2500 applications in the Market. Fundamental analysis is covered too, with news from international agencies and an economic calendar built into the terminal.
TM9 is a software development company and does not provide investment or brokerage services. The platform supplies the trading terminals, analysis tools and automation; your broker holds the funds, sets spreads and leverage, and executes the orders the platform sends. Trading carries a real risk of loss, and signals or robots are tools rather than financial advice.
Technical Analysis. Timeframes and Charts. Technical Indicators. Or open the Platform Guide for all 20 pages.