App preview
Inside Trade Master 9.
Up to 100 charts at a time across 21 timeframes, enabling comprehensive detailed analysis of all minor price movements.
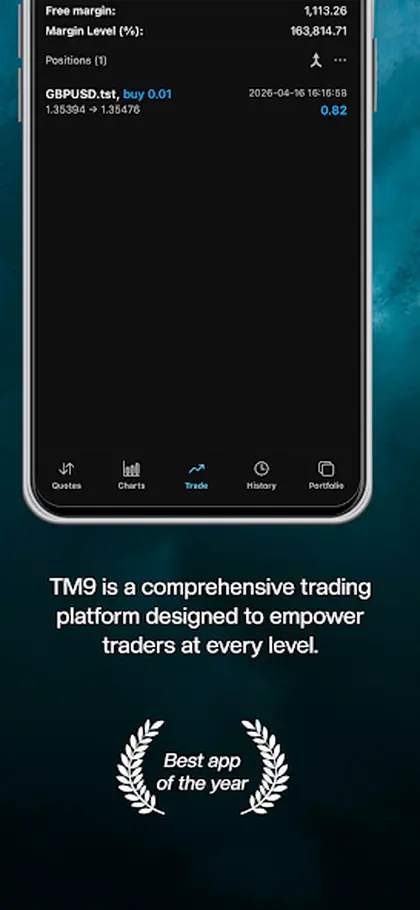
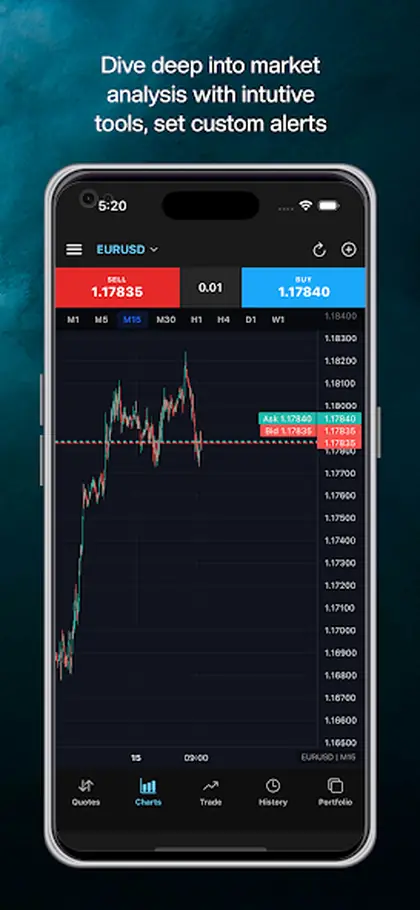
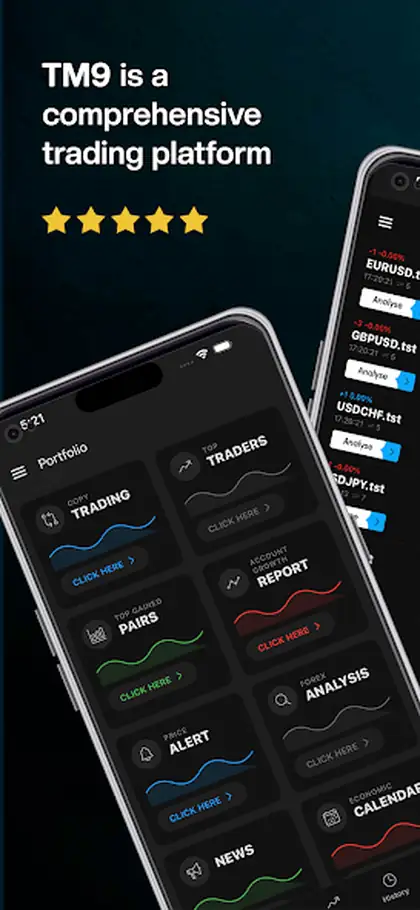
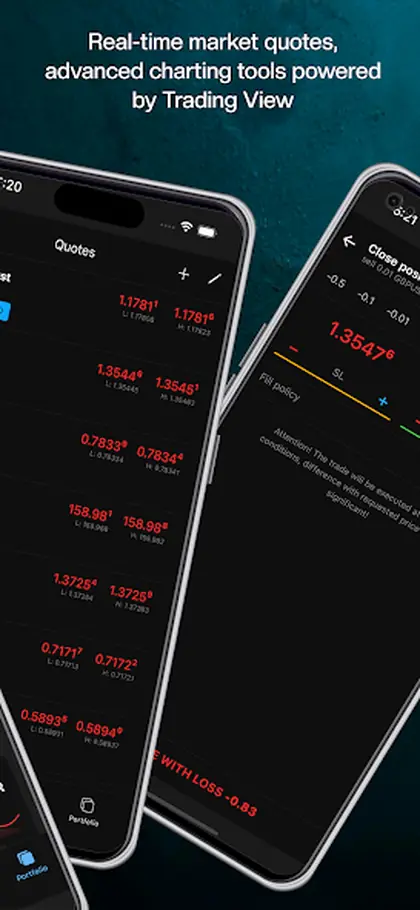
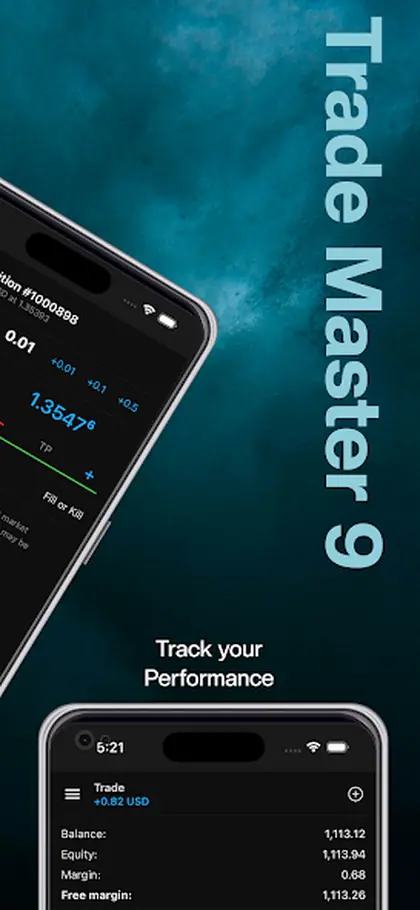
Multi-timeframe reading is routine work for anyone running operations in the forex and exchange markets from a trading mobile app.
Up to 100 charts at a time across 21 timeframes, enabling comprehensive detailed analysis of all minor price movements.
Ask an experienced trader what they look at and the answer is rarely one chart. A trading mobile app built for operations in the Forex and exchange markets has to support that reality, which is why Trade Master 9 allows up to 100 charts open at a time across 21 timeframes rather than a handful of fixed intervals.
Multi-timeframe reading is a discipline more than a feature. The higher interval tells you what kind of market you are in — trending, ranging, or somewhere uncomfortable in between. The middle interval is where the setup forms. The lower one is where you time the entry and place the stop. Getting those three to agree is what separates a considered trade from a reaction, and it requires intervals fine enough to be useful and coarse enough to see structure.
The chart count matters for a different reason. Traders who follow eight or ten instruments do not want to reload a single chart ten times, applying studies again each time. Keeping prepared charts open, each with its own indicators and drawings, turns a morning review into a few minutes of scrolling rather than half an hour of setup.
Graphic objects and more than 80 indicators sit on top of all of it, and templates keep the workload sane: build the view once, apply it to anything new. Because layouts and watchlists follow the account, the same arrangement is waiting whether you open the desktop terminal, the Web Platform or the phone. The other pages in this section cover indicators, fundamental data and the economic calendar, while the home page covers the app itself in full.
Up to 100 charts at a time across 21 timeframes, enabling comprehensive detailed analysis of all minor price movements.
Open up to 100 charts across 21 timeframes for detailed multi-timeframe analysis.
The 21 timeframes available enable comprehensive detailed analysis of all minor price movements, from the shortest intraday intervals upward.
The platform allows opening up to 100 charts of currency and stock quotes at a time, which is what makes genuine multi-instrument work practical.
Graphic objects sit alongside more than 80 technical indicators, so levels, trendlines and zones stay on the chart with your studies.
Three short notes on how this works day to day.
The common pattern is three charts per instrument: one for context, one for the setup, one for timing. With 21 intervals to choose from, that structure can be tuned to a strategy rather than forced into the four or five a simpler app offers.
Chart count is bounded by your machine rather than the licence, and every chart carries its own studies. Saving templates is what keeps a large workspace manageable when you add an instrument.
This page suits traders who read structure across intervals, and anyone whose current app limits them to a handful of charts.
How analysis sits inside the Trade Master 9 platform.
Trade Master 9 represents the all-in-one concept: up to 100 charts at a time, 21 timeframes, more than 80 technical indicators and graphic objects, plus thousands of free indicators in the Code Base and over 2500 applications in the Market. Fundamental analysis is covered too, with news from international agencies and an economic calendar built into the terminal.
TM9 is a software development company and does not provide investment or brokerage services. The platform supplies the trading terminals, analysis tools and automation; your broker holds the funds, sets spreads and leverage, and executes the orders the platform sends. Trading carries a real risk of loss, and signals or robots are tools rather than financial advice.
Technical Analysis. Technical Indicators. Fundamental Analysis. Or open the Platform Guide for all 20 pages.